Introduction
Within This Page
Chemical Sensors
Demand Controlled Ventilation (DCV)
DCV requires an active contaminant sensing system. The components include air sampling sensors, software to interpret the data and air handling system with modulating dampers that uses the data to regulate outside air supply and exhaust. Contaminants are:
- CO—Primarily in loading dock, parking garages and spaces with vehicular traffic.
- CO2—Use to gauge occupancy level in assembly spaces such as auditorium, lecture halls and conference rooms. Use for euthanization in Vivarium.
- Particles—Includes hair and dander in Vivarium.
- VOC—Used in laboratories for volatile and chemical spillage detection, in Vivariums for ammonia detection.
In most cases, the sensors used to monitor the different contaminants are the same. A sensor that detects particles and VOCs can also be used to detect CO2 with just a simple reprogramming of the software. The sensors also track temperature and humidity, but this data is backup information and not used to control the HVAC system because of potential conflicts between the two systems. Once contaminants are above a preset level as detected by the sensor, the lab control system is notified and ACH ramps up in stages or to the max designed value (aka an on/off system), depending on the mechanical design, to evacuate the contaminants. This allows for a low ACH of typically 4 when the air is clean and only increases the ACH when there is a demand for more fresh air to purge out the contaminants. Studies from operating research buildings have shown that labs with Demand Control Ventilation system operate at the low Air Change rate per hour 98% of the time. The difference between the on/off and ramp up system is only in the software and operations sequence. The ramp up system conserves energy by introducing the minimum amount of additional fresh air to exhaust the contaminants. It also puts less stress on the AHU system. However, some institutions prefer the on/off system for immediate purging.
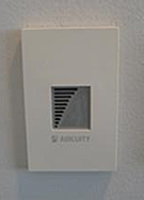
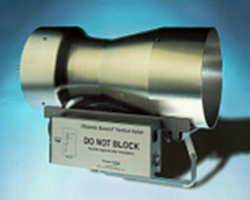
Photo courtesy of Perkins+Will
Image courtesy of Phoenix Controls
Sensors can be wall mounted or located in exhaust duct.
DCV Operation Possibilities
To further conserve energy, an unoccupied mode reducing ACH to 2 can be implemented. To do this without a DCV system, ASHRAE requires an occupancy schedule be established and strictly followed. No entry is allowed into a space where the HVAC system is operating in unoccupied mode. One hour before occupancy, the ACH has to increase to the occupied setting. This fixed schedule interferes with research as research activities are flexible and happen at all hours of the day. With DCV and its real time active sensing capability, flushing is possible in unoccupied mode and therefore this restriction is removed as stated in the 2011 ASHRAE revision. Occupancy/motion sensor that controls light fixtures can signal the lab control system when a space is unoccupied or occupied. This allows for real time and immediate adjustment to the ACH.
The latest revisions to the guidelines include lowering the fume hood minimum flow rate. NFPA 45 2011 removes its minimum flow rate recommendation of 25 cfm/sf of interior hood work area and now only refers to ANSI Z9.5. ANSI Z9.5-2011 now recommends a minimum flow rate of 10 cfm/sf of interior hood area when the sash is closed. This reduction in hood flow corresponds to a decrease in ACH in the lab. In combination with DCV system, the ACH can be driven down further in hood dominant labs.
Description
Installation in Existing Research Buildings
DCV offers significant saving potential and should be used to reexamine ventilation rate in existing laboratories. The air change rates for most facilities can be safely reduce from 10–12 to 4–6 during regular operating hours and even lower during unoccupied hours. Safety is actually improved over the traditional standard air exchange rate because the air sampling increases the ACH immediately after a spill occurs. This system has been proven to flush the room more quickly than the constant flow systems. This is a key strategy in laboratory buildings, old and new, to become more energy efficient. DCV can be implemented into a facility with Variable Air Volume (VAV) system. VAV hoods are preferred as well. The following are steps taken when considering DCV in an existing facility:
Confirm rooms targeted have general exhausts (some use hoods for room exhaust and are not candidates), and insure one duct probe/1,000 to 1,200 sq. ft. of lab space.
Ask client if existing minimum air change rates are known; if not, request BMS trend data of supply air terminals to define minimum flows—if trend data is not available, then a review the room balance sheets, or the TAB reports to determine the minimum box flows when the hoods are in minimum flow.
Review floor plans, including mechanical ventilation drawings, to understand lab layout/configuration; eliminate fume hood driven zones (defined as having more than 2 fume hoods/500–700 square feet). However, for these spaces, re-balancing the fume hood minimums to the new ANSI 9.5 standard (lowering the former guideline of 25 CFM/sq. ft. of fume hood work surface area to the new guideline of 12–25 CFM/sq. ft.)
Verify existing VAV terminal devices can accomplish the new CFM setpoint that corresponds to the lower ACH levels. This can be a problem for non-Phoenix systems. The system should also be able to stay in balance (maintain offsets) from an airflow perspective.
During this process, some of the existing lab airflow equipment will be found to be not working properly, so some funds should be set aside for retro-commissioning. This can be in a contingency fund that is set up by the owner, and only used if defective equipment is found during the commissioning process; or carry additional contingency in project for these repairs.
Determine if lab commissioning will occur after system is started up.
Determine how much information will need to be displayed by the BMS.
Confirm which AHU's serve which labs to insure the proper supply air references are located and included in the scope of work.
Determine what alarms will be required by the owner. Contamination alarms, emergency ventilation override push buttons?
Confirm integration strategy with BMS (hard wired vs. BacNet)
"Facilities have become as complex as the research that goes on within them. Putting together the right team and aligning them with the same vision and goals is critical to the success of a project and the environments created by it for years to come. Having specialists as part of this team was key to getting it right." — Jill Pearsall, Director of Facilities Planning and Development at Texas Children's Hospital.
Application
Case Study: TCH NRI
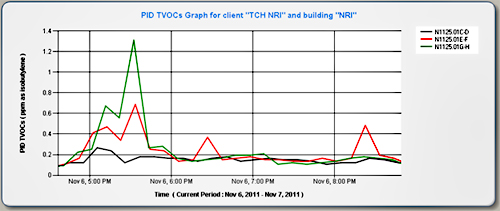
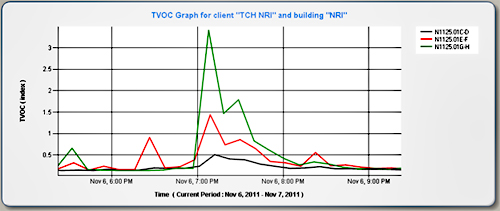
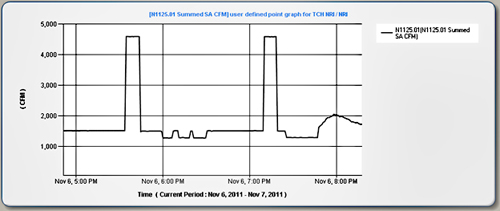
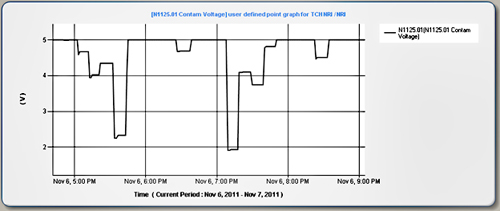
The Texas Children's Hospital Neurological Research Institute has three lab floors with DCV, two laboratories per floor. Each floor has its own dedicated air handling unit and exhaust is via a centralized system. The system is designed to operate at a maximum 10 ACH in purge mode and 4 ACH when the air is clean. The following graphs taken over the same time period illustrates how a DCV system works.
Nick Merrick © Hedrich Blessing 2010
Courtesy of Perkins+Will

Source: Aircuity
This graph shows the total volatile organic compounds (TVOCs) detected by a photo ionization sensor. This particular sensor detects VOCs from 0.1 to 5 parts per million (ppm). Between 5 and 6 PM, it shows a rise in VOCs. This photo ionization sensor can be calibrated to detect trace amount of ammonia, suitable for use in Vivariums.
Source: Aircuity
At around 7PM, the Metal Oxide sensor detected an increase of VOCs. This sensor detects VOCs in the range of 5 to 100ppm. Both of these sensors are incorporated into one assembly, allowing the detection of VOCs over a wide range of ppm.
Source: Aircuity
In both instances, the ventilation rate of the lab increases as depicted by the increase of supply CFM. This causes a sharp decrease in VOCs after it peaks in the first two graphs. Once the contaminants are purged and the air is "clean", the supply CFM returns to its normal rate, illustrating the effectiveness of DCV. Note the supply CFM value does not correspond to ACH as up to 40% of the clean lab air is recirculated, reducing the energy used to cool and reheat and circulate outside air. This is possible with the lab areas contain within its own zone; air from outside the labs is not recirculated into the labs since other areas do not have the air sampling sensors to ensure the air is clean.
Source: Aircuity
The sensors communicate with the lab control module by sending a voltage drop signal. Once the voltage reaches 2.5V, it triggers the system into purge mode. Since this is an on/off system, the ACH switches to the maximum value of 10 immediately. As discussed earlier, the system can be calibrated to ramp up the ACH slowly, with each voltage drop corresponding to a preset ACH value.
Based on 10 ACH without DCV, the lab volume, number of hoods and set points, our analysis for payback is as follows:
- DCV System: $265,000
- Sensor replacement: $20,000 per year
- At 10 ACH day/night, we estimate the average CFM for the six flex laboratories to be 39,000 CFM
- Observed average supply CFM with DCV system: 15,000 CFM
- Saving of 39,000 CFM—15,000 CFM = 24,000 CFM
- Based on energy rates provided by Texas Children's Hospital of $14.50/CFM for the facility, total is $348,000.
Payback at Ten Months
This incredible combination of reducing operation costs while increasing safety is achieved by the fast response of the variable fan drive (VFD) to an alarm from the air sampling sensors. As soon as a spill is detected, the fan automatically increases the 4 ACH up to 10 ACH to quickly provide fresh air to the spill zone. Historically Lab area HVAC cost and ACH rates are cut in half by using this constantly monitored VFD Exhaust system. This solution should be implemented in most research building and hospitals to monitor air quality, increase safety and reduce cost.
The payback period varies by project, affected by the sensor replacement schedule, designed minimum and maximum ACH, utility rates and the use of energy recovery system. In some cases, first cost could be reduced by downsizing the AHUs and main ductworks as the probability of a spill happening in all the spaces at once is small. This needs to be evaluated on a project basis.
Source: Aircuity
Relevant Codes and Standards
The following agencies and organizations have developed codes and standards affecting the design of research laboratories. Note that the codes and standards are minimum requirements. Architects, engineers, and consultants should consider exceeding the applicable requirements whenever possible.
- ANSI/AIHA/ASSE Z9.5 Laboratory Ventilation
- ANSI/ISEA Z358.1 Emergency Eyewash and Shower Equipment
- Association for Assessment and Accreditation of Laboratory Animal Care (AAALAC) Standards
- Biosafety in Microbiological and Biomedical Laboratories, 5th Edition—Department of Health and Human Services, Centers for Disease Control and Prevention and National Institutes of Health
- Code of Federal Regulations, 29 C.F.R. § 1910.1450 "Occupational Exposures to Hazardous Chemicals in Laboratories" (OSHA)
- PBS-P100 Facilities Standards for the Public Buildings Service—General Services Administration (GSA)
- NIH Design Policy and Guidelines—National Institutes of Health
- Guidelines for the Laboratory Use of Chemical Carcinogens, Pub. No. 81-2385—National Institutes of Health
- NFPA 30 Flammable and Combustible Liquids Code
- NFPA 45 Standard on Fire Protection for Laboratories using Chemical
- Unified Facilities Guide Specifications (UFGS)—Tri-Services, organized by MasterFormat™ divisions, are for use in specifying construction for the military services. Several UFGS exist for safety-related topics.
Additional Resources
Publications
- Building Type Basics for Research Laboratories, 2nd Edition by Daniel Watch. New York, NY: John Wiley & Sons, Inc., 2008.
- CRC Handbook of Laboratory Safety, 5th ed. by A. Keith Furr. Boca Raton, FL: CRC Press, 2000.
- Design and Planning of Research and Clinical Laboratory Facilities by Leonard Mayer. New York, NY: John Wiley & Sons, Inc., 1995.
- Guidelines for Laboratory Design: Health and Safety Considerations, 4th Edition by Louis J. DiBerardinis, et al. New York, NY: John Wiley & Sons, Inc., 2013.
- Guidelines for Planning and Design of Biomedical Research Laboratory Facilities by The American Institute of Architects, Center for Advanced Technology Facilities Design. Washington, DC: The American Institute of Architects, 1999.
- Handbook of Facilities Planning, Vol. 1: Laboratory Facilities by T. Ruys. New York, NY: Van Nostrand Reinhold, 1990.
- Laboratories, A Briefing and Design Guide by Walter Hain. London, UK: E & FN Spon, 1995.
- Laboratory by Earl Walls Associates. May 2000.
- Laboratory Design from the Editors of R&D Magazine.
- Laboratory Design, Construction, and Renovation: Participants, Process, and Product by National Research Council, Committee on Design, Construction, and Renovation of Laboratory Facilities. Washington, DC: National Academy Press, 2000.
Others
- Laboratories for the 21st Century (Labs21)—Sponsored by the U.S. Environmental Protection Agency and the U.S. Department of Energy, Labs21 is a voluntary program dedicated to improving the environmental performance of U.S. laboratories.


