Introduction
Within This Page
Buildings are the major source of global demand for energy and materials that produce by-product greenhouse gases (GHG). Slowing the growth rate of GHG emissions and then reversing it is the key to addressing climate change and keeping the average global temperature below the 2°C above pre-industrial threshold.
To accomplish this, Architecture 2030 issued The 2030 Challenge asking the global architecture and building community to adopt the following targets over the next twenty years:
-
All new buildings, developments and major renovations shall be designed to meet a fossil fuel, GHG-emitting, energy consumption performance standard of 60% below the regional (or country) average for that building type.
-
At a minimum, an equal amount of existing building area shall be renovated annually to meet a fossil fuel, GHG-emitting, energy consumption performance standard of 60% of the regional (or country) average for that building type.
-
The fossil fuel reduction standard for all new buildings and major renovations shall be increased to:
- 70% in 2015
- 80% in 2020
- 90% in 2025
- Carbon-neutral in 2030 (using no fossil fuel GHG emitting energy to operate).
These targets may be accomplished by implementing innovative sustainable design strategies, generating on-site renewable power, and/or purchasing (20% maximum) renewable energy.
Source: Architecture 2030—The 2030 Challenge
Description
Focus on Research Buildings
The challenge is clear: to build and operate net-zero carbon buildings by the year 2030. But how will the challenge be met? This document is intended to be a clear and simple roadmap that will identify specific ways to improve existing research laboratory facilities in an effort to meet the 2030 Challenge.
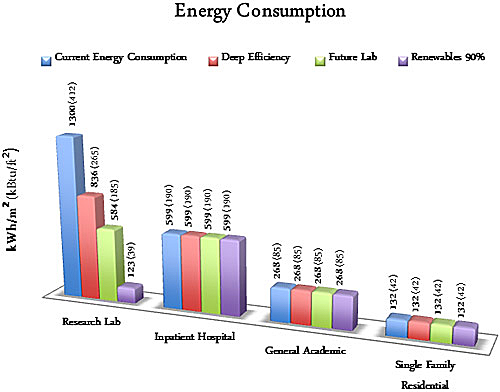
While many of the ideas presented in this document are applicable to other building types the focus of this page is primarily on the renovation of research buildings as these buildings are historically the largest consumers of energy. As is evident in the chart below, research buildings expend substantially more energy than other building types such as hospitals, office buildings, and residences. Thus, net-zero carbon research buildings have the potential to make the largest impact on reducing greenhouse gases.
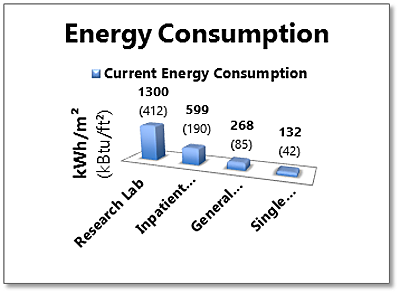
1 Square Meter (Square Foot) of Research Space = Energy Use of 9+ Square Meters (Square Feet) of Homes.
Source: Peter Rumsey, Integral Group
Currently, there are a significant number of research facilities that need to be upgraded and it has been found that most researchers are highly receptive to new ideas and challenges. This document is intended to provide concrete methods to do so.
Focus on Renovations of Existing Buildings
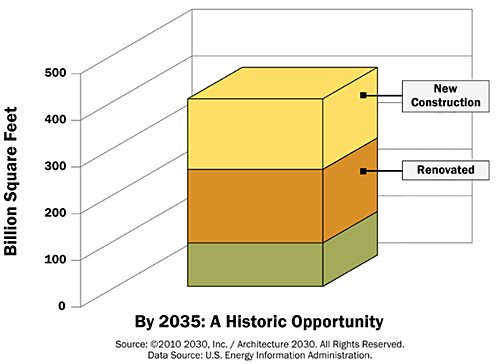
As of 2010, the total U.S. building stock was approximately 300 billion square feet.
- During normal economic times, approximately 1.75 billion sf. of buildings are torn down each year.
- Every year, approximately 5 billion square feet are renovated.
- Every year, approximately 5 billion square feet are new construction.
The numbers above address approximately 3.5% of the existing buildings each year and adding another 2% to the total building stock each year. By 2030 over 60% of the existing building stock will be renovated and an additional 20% of buildings will be added to the U.S. landscape.
Source: 2010 2030, Inc./ Architecture 2030
Data Source: U.S. Energy Information Administration
This is very significant and another reason why we should focus on the 2030 zero carbon initiative now because within the next 18 years we can make a significant impact.
CSL Stairwell.
Photo Credit: Denmarsh Photography, Inc.
By the year 2035, approximately three-quarters (75%) of the built environment will be either new or renovated. This transformation over the next 25 years represents a historic opportunity for the architecture and building community to avoid dangerous climate change.
The Strategy: An Overview
The strategy is divided into four phases as a means of gradually reaching carbon neutrality by 2030. The first phase is a financial plan that focuses on key ideas to consider from today to 2015. This phase addresses the "low hanging fruit"—actions that will have little or no initial cost to an organization beyond the time and labor costs of focusing individuals (either from within or outside consultants) on the effort. Many of these actions will have an immediate financial payback, while the others will have a financial payback well within five years. The next three phases are financial plans for the years 2015–2020, 2020–2025, and 2025–2030.
Plan Overview to Get to Zero Carbon by 2030
2012-2015 Plan Summary
- Improve Work Habits
- Purchase Energy Efficient Laboratory Equipment
- Understand Building Performance
- Re-Think the Science of Research
- Reduce the Waste Stream
The purpose of this article is to focus on behaviors within the lab and the operations of facilities that should be implemented by 2015. Many of these actions will have an immediate financial payback, while the others will have a financial payback well within five years.
The ideas presented in the body of this document offer many of the most significant opportunities to save energy and reduce carbon for existing research facilities. When successfully implemented, a combination of several of these modest strategies will create significant results.
It is strongly recommended that at least 50% of the annual savings each year be used to purchase new solutions that will ultimately elevate the existing facility to net-zero by 2030. We suggest that a comprehensive 2030 strategic plan be finalized by 2015. In the meantime, focus on changing habits and saving money by reducing energy costs now. The payback estimates for 2015 and beyond are projected based upon where experts believe the technology will be at that point in time. For example, photovoltaic panels may have a 15–18 year payback today but by 2020 they are expected to be financially viable with a payback of seven years or less.
The key goal is to share ideas and provide the latest data to all those who are interested in the most efficient lab trends. That being said, we cannot do this without input from organizations around the world. Sharing recent data as well as success stories will encourage others around the world to step up and meet the 2030 challenge—and save money while doing it!
Summary of Ideas for 2012 to 2015
Goal: 20–30% Reduction in Energy/Carbon
1. Improve Work Habits
-
Adjust the Thermostat in winter and summer to be more tolerant of the warmer and cooler temperatures. This is a simple change that should become a policy with the institution and impacts all buildings.
For research buildings, zoning of thermostats by floor or space type is very helpful in reducing energy costs. NIH benchmarks their research space according to the cost of the energy used to run each space.
-
In the winter, lower the thermostat from 72 to 68°F or lower.
People can wear a sweater or another layer of clothing if necessary. This is common practice in many other countries such as China.
Investigate whether or not reheat is necessary. The principal investigator or lab manager should determine how low the humidity can be. It may be possible to increase the supply air temperature if the air does not have to be as dry, thereby reducing the need to reheat the air.
Case Study: Harvard University
During the cooling season (which can be surprisingly long in many lab facilities, including all winter in some areas), Harvard maintains a temperature policy of cooling to no lower than 74°F. This policy was approved by the Deans of each school in recognition of the fact that for each degree increase in the heating set point, we consume 3% more energy on average, and emit 3% more emissions [U.S. DOE]. Space heaters are banned at Harvard and should be discouraged at all institutions. -
In the summer, the thermostat should be set between 74 and 78°F rather than the typical range of 70 to 72°F.
Many European countries as well as China have building codes that require operable windows. Using cross ventilation during the summertime can be more energy efficient and more comfortable than air-conditioning. It is better to use fans in spaces that are not wet research labs to help provide convenience cooling for people. Fans use one tenth the energy of air-conditioning.
Case Study: Harvard University
During the heating season (roughly mid-October through mid-April), Harvard maintains a temperature policy of heating to no more than 20°C (68°F). -
Lower the thermostat by 10 to 15°F degrees for 8 hours or more at a time.
The Department of Energy (DOE) has advised that a building can easily save energy in the winter by setting the thermostat to 20°C (68°F) during hours when occupants are awake and setting it lower when occupants are asleep or away from the building. For laboratory buildings, the setback should be able to occur in the evenings and in many cases throughout the entire weekend. In the winter the setback can be 16°C (60°F) and in the summer 26°C (78°F). By turning the thermostat back by 6 to 8°C (10°F to 15°F) for 8 hours, between 5 and 15% can be saved a year on the heating bill—a savings of as much as 1% for each degree if the setback period is eight hours long. The cost of the energy to increase or decrease the temperature when the building or laboratory is occupied is estimated within the 1% savings guideline. The percentage of savings from setback is greater for buildings in milder climates than for those in more severe climates.
-
Other key ideas to implement include avoiding or minimizing operations during peak energy use for the building, where the campus or region is located. For some countries such as India, this is actually required.
-
Reconsider reheat. If humidity control is not required reheat may be avoidable. Range of humidity for most laboratories is 30 to 60%.
-
-
Lights
According to information published by Labs21, lighting energy use for laboratories range between 8% and 25% of the total electrical use. Electric lighting should always be designed as a supplement to daylighting. It is also recommended that all natural light into buildings be indirect light in order to minimize heat gain and reduce the glare problems on computers.
-
Use direct-indirect ambient lighting parallel to the bench-top. The ceiling should have at least 80% reflectance, and walls should have a reflectance of 65% or more.
-
Lower usage from 700 lux (70 fc) to between 300 and 500 lux (30 and 50 fc) for ambient lighting. This is the amount recommended by Labs 21.
The NIH currently allows 500 lux (50 fc) in their labs, which has been decreased from the previous minimum requirement of 700 lux (70 fc).
Benchmarks ID Metric Unit Standard Practice Good Practice Better Practice Building B1 Building Source Energy Use Intensity Source BTU/gsf-yr Meet ASHRAE 90.1; 3rd quartile in Labs21 database 20% below ASHRAE 90.1; 2nd quartile in Labs21 database 30% below ASHRAE 90.1; 1st quartile in Labs21 database Ventilation System V2 Minimum-Laboratory Ventilation Rate: Volume baseded ACH > 6 6
(justified if > 6)4
(justified if > 4)V3 Fumehood Density hood-ft/nsf V6 Ventilation Peak Airflow Efficiency W/cfm 1.8 1.2 0.6 V8 Total System Pressure Drop in. w.g. 9.7 6.2 3.2 Cooling and Heating System M1 Temperature Deadband F 70–74 Justified if tighter than ASHRAE 55 M6 Cooling System Peak Load Efficiency kW/ton 0.8 0.6 M8 Chiller Rated Efficiency NPLV Meet ASHRAE 90.1 10% better than ASHRAE 90.1 20% better than ASHRAE 90.1 M11 Chiller System Minimum Turndown Ratio — 5 (20%) 10 (10%) 20 (5%) M16 Reheat Energy Use Factor % (reheat btu/total heating btu) 20% 5% 0% M20 Energy Recovery Effectiveness % 45 (sensible) 60 (sensible) 70 (total) Process Loads P1 Laboratory Plug-Load Intensity W/nsf 8–15 Based on measured P2 Laboratory Plug-Load Sizing Ratio – (design/measured) > 4 Justified if > 2 Lighting System L3 Laboratory Task Illuminance Design fc 80–100 (task+ambient) Julstified if > 75 Justified if > 50 L5 Laboratory Lighting Installed Power W/nsf 1.8 1.3 1.1 Source: John Mlade, Perkins+WIll
-
Remove fluorescent bulbs in over-lit areas. U.C. Santa Barbara initiated a program encouraging users to report lights in over lit areas (removed by maintenance staff). Removing 15 to 20% of lights in a standard lab facility can reduce overall lab energy needs by 4%.
-
Use daylight controls for ambient lighting in the perimeter zones.
-
Ensure the lighting zones are small enough to provide local control.
-
Use bi-level switching. This is required by building codes in many areas. In a typical installation, one switch controls 1/3 of the lamps while the other controls 2/3 of the lamps. This allows for four light levels: off, 1/3, 2/3 and full.
-
Provide mobile LED task lighting. LED task lighting works very well and is affordable today. Consider mobile task lighting for approximately 25% of the bench area. The task lighting can be placed where it is necessary and be very affordable when they can be moved easily. LEDs should be used in new construction and retrofit applications. They are not being widely implemented currently due to the fact that it requires the replacement of the entire fixture.
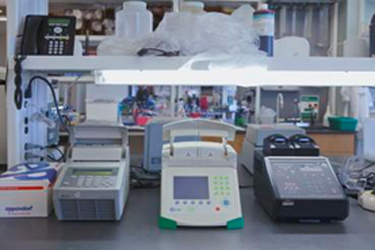
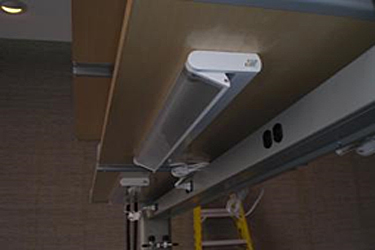
Photo Credit: Mark Rahe, Perkins+Will
-
-
Better Computer Management
Source: Peter Rumsey, Integral Group
Research is becoming less "hood driven" and is instead becoming more "computer driven." As computers continue to grow in simulation modeling and other applications in the research process, the management of the energy to run the servers and computers is very important.
-
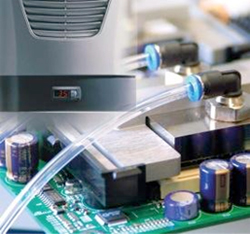
Use Water Cooled Servers. Data Centers now have the ability to be run within spaces that are higher temperatures. Water cooled servers are much more energy efficient than the traditional air cooled approach.
-
Enable desktop power management of computers. Putting computers to "sleep" typically results in savings of 75% in energy costs. There are no initial costs and the payback is immediate.
-
-
Miscellaneous Tips:
- Turn off power strips and unplug unused devices to sojourn "vampire" electronics.
Examples include: centrifuges, fans, monitors, printers, water baths, thermocyclers - Appraise Energy Star ratings prior to purchasing new instrumentation.
- Combine items to run fuller loads.
- Turn off power strips and unplug unused devices to sojourn "vampire" electronics.

Source: Peter Rumsey, Integral Group
2. Purchase Energy Efficient Laboratory Equipment
It is important when comparing performance among various vendors that the conditions of the tests performed have been verified and the savings evaluated in a holistic manner. For example, does a smaller freezer proportionately use less energy than the larger freezer?
Energy efficiency rating system needs to be developed to provide NIH purchasers information about energy efficient equipment.
Source: Peter Rumsey, Integral Group
- Fume Hoods
-
Keep the Sash Down.
If a fume hood on a VAV control system is not in use, keeping the sash open wastes about $1,500 in energy costs per year per hood. This is approximately the same amount of energy needed to run a typical house in the United States.
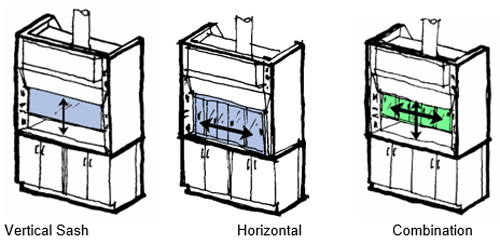
An array of fume hood options is available to lab designers and researches. Each fume hood carries with it an associated energy burden (1 fume hood is approximately equal to the energy consumed by a typical American home on an annual basis). Combination sashes reduce the opened area and thus minimize air volumes exhausted (and thus amount of 100% outside air conditioned and supplied to the space).
A combination sash costs approximately $1,000 more than the vertical sash. If the researcher has not used a combination sash, it is highly recommended to provide a hood mock up with a combination sash to test.
High Efficiency or low-flow fume hoods also offer opportunities for energy reduction. Savings here can be both infrastructure and operational energy. ASHRAE 110 Testing, as installed, is recommended for low-flow fume hoods. Recent testing at a California-based Biotechnology firm showed effective operation at 60fpm. California code requires 100fpm, a variance was granted for the project at 80fpm.
In 2005, Harvard initiated a fume hood campaign called "Shut the Sash." Their goals were to increase awareness of energy use and to encourage the development better habits in the lab. Harvard used a variety of visual aids, from posters to electronic meters, to remind students and faculty to keep the fume hoods closed. Professors also selected a volunteer to "police" their labs for open fume hoods. Harvard started a competition among their lab buildings to see who could do the best. As an incentive, the most effective lab would receive a wine and cheese party. Throughout the period of the campaign, the average sash height of all fume hoods decreased from 12 inches to just 2. In the end, Harvard's campaign saved the university $100,000 on energy costs each year. It has also increased the student's awareness of their habits of remembering to close the fume hood when not in use. After the success of the first campaign, Harvard now has an ongoing effort to train new students in difficult art of closing the sash.
A few years ago, a student at MIT did a research project on fume hoods on campus. He found that many of these were left open which was wasting huge amounts of energy. His research led others on campus to continue the work that he started and began bringing awareness of the issue to students and faculty on campus. One graduate student took the initiative to make sure people were aware of shutting their sashes by sending out e-mails, putting up posters, and spreading the word around. They have seen that once students become aware and get reminded, they make the effort to shut the sash when they are no longer using the fume hood. MIT has found that by students participating in closing the fume hoods, they could potentially save the university one million dollars each year from fume hoods alone.
Some institutions have a person assigned to walk through the laboratories at the end of the day to lower the sashes. It is recommended that a policy be established to keep the sashes lowered when not in use. Many institutions have tried competitions and incentives. They are well intended but usually the results are short term and the end users go back to previous poor habits.
-
Use an Automatic Sash Closure
Technology exists for retrofit applications. The retrofit requires a variable air volume (VAV) solution and additional sensors.
Pacific Gas and Electric conducted a study at UC Davis that demonstrated significant savings by implementing an auto sash closure system. They paid approximately $4,500 per hood and the simple payback was one to four years. A 2.3 to 2.5 year payback would be typical for a hood driven load. Approximately $3.40 to $3.90/cfm was saved for a typical six foot hood. This amounted to an annual savings of approximately $1,700.
Consider static pressure reset strategy with the retrofit to increase savings.
Try Lawrence Berkeley's National Laboratory's web based fume hood calculator.
-
Disable or Remove Unused Fume Hoods
A standard 6' constant volume hood uses over 35,000kWh/year in chiller and fan energy (equivalent to 3-1/2 homes). UC Santa Barbara actively encourages lab users to report underutilized and not utilized fume hoods in labs. These hoods are then evaluated by campus engineering and EH&S and typically either disconnected or physically removed.
-
Purchase New High Performance Hoods
-
| Baseline | Option 1 | Option 2 | Option 3 | Option 4 | |
| Product Name | SafeAire II | SafeAire II | Concept | Concept | Pioneer |
| Hood Style | Bench | Bench | Bench | Bench | Bench |
| Sash Type | Vertical | Vertical | Vertical | Combination | Vertical |
| Sash Opening Height x Width [mm](in) |
724 x 1595 (28.5 x 62.8) |
724 x 1588 (28.5 x 62.5) |
724 x 1588 (28.5 x 62.5) |
610 x 1588 (24.0 x 62.5) |
699 x 1588 (27.5 x 62.5) |
| Sash Opening Area [m²](SF) |
1.2 (12.4) | 1.2 (12.4) | 1.2 (12.4) | 1.0 (10.4) | 1.1 (12.0) |
| Face Velocity [m/s](FPM) |
0.5 (100) | 0.4 (80) | 0.3 (60) | 0.3 (60) | 0.25 (50) |
| Exhaust Volume [m³/h](CFM) |
2,107 (1240) | 1,685 (992) | 1,264 (744) | 1,060 (624) | 1,019 (600) |
| Number of Hoods | 77 | 77 | 77 | 77 | 77 |
| Total Exhaust Volume = Number of Hoods x Exhaust Volume [m³/h](CFM) |
162,239 (95,480) |
129,745 (76,384) |
97,398 (57,288) |
81,620 (48,048) |
78,463 (46,200) |
| Operating Cost [$] = Total Exhaust Volume x$2.94 per m³/h*year ($5.00 per CFM*year) |
477,400 | 381,920 | 286,440 | 240,240 | 231,000 |
| Project Cost Savings from Baseline | $95,480 | $190,960 | $237,160 | $246,400 | |
| Key Variables |
|
|
Reduced exhaust volume from 1264 to 1060 m³/h (744 to 624 CFM) |
|
Study provided by Thermo Scientific.
Face Velocity—Several governmental and industry organizations have adopted fume hood safety standards. These standards are designed to measure a fume hood's ability to contain fumes. They are based on a measurement of the speed at which laboratory air enters a fume hood's face opening, i.e. face velocity. The intent of these standards is to designate face velocities that are high enough to contain fumes but not so high as to cause air turbulence between a hood's face and a worker.
[m/s](FPM)—airflow speed at Sash Opening
[m³/h](CFM)—Exhaust Volume when applied to fume hoods
Sash Size—To calculate Exhaust Volume:
1. Calculate Sash Opening Area
2. Multiply Sash Opening Area x Face Velocity
Three ways to lower Exhaust Volume:
A. Lower the Face Velocity
B. Reduce the Sash Opening
C. or do both A and B
(Calculate the Total Exhaust Volume (of fume hoods) to achieve the desired room air change rate per hour.)
-
Replace Old Biosafety Cabinets with Energy Efficient Model
-
Use appropriate Biological Safety Cabinets. . . Educate Users (B2 cabinet 3x cost to operate than A2)
The average cost of external exhaust (B2) estimated at $2,100 per Bio-Safety Cabinet each year. The average of all non-exhaust (A2) costs is $240 per Biosafety Cabinet per year (Moffitt study by Thermo Fisher)
The Return on Investment (ROI) on replacing the externally exhausted BSCs range from 2.45 to 5.05 years assuming replacement with energy efficient, non-exhausted 4ft. BSC. If the replacement is before planned filter change and certification, ROI ranges from 1.92 to 3.94 years.
Provide power users with energy efficient BSCs. Plan for retirement of older BSCs. National Science Foundation (NSF)/ANSI 49 gives approximate lifespan of 15 years for BSCs.
Improvements in bio-safety technology have also shown improvements for containment, ergonomics, serviceability, and energy efficiency.
Switch from AC to DC motors on high usage cabinets. Save approximately $800 in energy costs per year for each cabinet. Four foot AC cabinets operate at 800 watts, but DC cabinets perform at approximately 210 watts.
-
Use CarbonNeutral® Products
BioMAT Class 2—The world's first Carbon Neutral Class 2 Microbiology Safety Cabinet. All materials used within the new BioMAT2 have been carefully selected in order to minimize embedded carbon emissions wherever possible. Work with the Carbon Neutral Company to measure and reduce product carbon emissions to net zero. Ensure that every ton of CO2 emitted by supply of a BioMAT2 Safety Cabinet an equivalent CO2 amount was saved. Cradle to Grave research of emissions. Overall power consumption reduced to 190W.
- See Contained Air Solutions Ltd for more information.
-
- Freezers/ Refrigerators
-
Replace Old Freezers with New Energy Efficient Freezers
Only use -80°C storage when absolutely essential. A typical -80°C upright freezer consumes 35 kWh/day plus additional cooling to dissipate heat output.
When use of -80°C storage is essential the use of water cooled freezers are more efficient that using air cooled.
See The following for efficient air-cooled refrigerators and freezers:
- Thermo Scientific Revco UxF -86°C Upright Ffeezers
- Fisher Scientific Isotemp General Purpose Refrigerators
- Fisher Scientific Isotemp General Purpose Freezers
Elimination of one -80°C freezer = $1,000+ savings in energy cost per year (this does not account for additional heating load, maintenance and space used).
The Store Smart program was started at University of California Davis with a goal of using laboratory cold storage as efficiently as possible. The program seeks to partner with researchers to improve sample access, reduce the risks related to freezer use, and save energy. About 1,000 ultra-low temperature (ULT) freezers are in use at UC Davis and demand is growing. Each ULT freezer annually uses an equivalent amount of electricity as a typical single family home, as well as incurring maintenance costs. When a freezer fails, samples may be lost permanently or damaged, jeopardizing research projects and data archives. And, without sample management tools, samples and bioassay materials can be misplaced or forgotten about, resulting in an uncertain archive of important scientific data.
"Freezers, fridges, and liquid nitrogen dewars can use up to 5% of all energy used in labs, and often have an additional energy 'overhead' of cooling needed to remove the heat they generate. Surveys at Newcastle, York and other universities—summarized in S-Lab's Sustainable Lab Procurement paper—have shown great variation in cost between different makes, sizes, types of device. Ultracold (-60 to -80°C) freezers use between 7.5 (the latest green models) and 20 kWh per 1 liter of storage, translating into £1,000 ($1,500) a year or more for many models."
Source: S-Lab Briefing 4: Effective and Energy Efficient Cold StorageNIH is focused on overall efficiency of the freezers and best value based on kW/ft³. A typical freezer older than five years uses 9,000 to 12,000 kW/year. New freezers with the same storage capacity can save up to 5,000 kW/year. It is important to study the freezers and evaluate in a holistic manner. Horizontal freezers should operate more efficiently but two vertical freezers can fit in the same space as one horizontal freezer. Need to consider the value of the space and the efficiency of the layout to understand all cost savings. Pack samples efficiently and share freezers between labs.
Larger freezer units are typically more efficient:
"Considered on a kW per cubic feet basis. A newer 26ft³ unit consumes 0.5kW/ft³ while a smaller 5ft³ unit uses 1.5kW/ft³."
(NIH - Farhad Memarzadeh) -
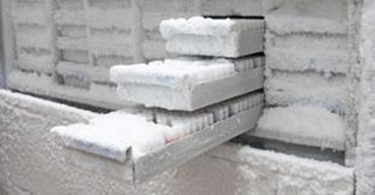
Clean, Defrost, and Manage Freezers More Efficiently.
Source: Stanford University
Outdated and unnecessary samples typically constitute a significant portion of freezer storage. Inventorying freezers and then periodically reviewing and discarding unwanted samples can help avoid adding additional freezers. Defrost and check seals regularly.
Some labs prevent graduate students leaving old samples in the freezers by raising the issue in the completion form they must submit and have countersigned by their Principal Investigator and lab technician before graduation.
-
-
Room Temperature Sample Storage (RTSS)
The RTSS technology prevents the degradation of biological materials such as DNA, RNA, and bacteria at room temperature, which eliminates the need for cold storage and cold shipping. The pilot study conducted at Stanford revealed significant benefit and opportunities for savings by considering RTSS. Stanford Pilot Study Conclusions : 20 to 25% of Stanford's total sample collection (9 to 13 million samples) could be moved from freezers to room temperature technology.An initial investment could be recovered within 3 to 5 years. The Stanford pilot program could regenerate an estimated 11 to 20 million dollars in cost reductions as well as prevent 17 to 20 thousand tons of CO2 from entering the environment. In addition to direct benefits, transferred samples would be shielded from degradation due to power disruptions, and thousands of square feet of lab space could be liberated for better use. The value of a sample can range from $2,500 to $10,000. Sample loss can add up quick. Benefits revealed in this report could be realized immediately and continue to generate savings for many years.
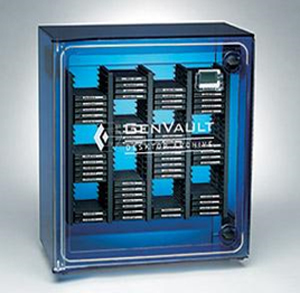
Source: Genvault
The RTSS technology is based on extremophile biology where organisms protect themselves for long survival in dried states and later revive by simple rehydration. Integrity and quality of samples stored using RTSS for 3 weeks have been evaluated through a National Human Genome Research Institute (NHGRI) grant. See Green Technologies for Room Temperature Nucleic Acid Storage from Current Issues in Molecular Biology.
"In Japan DNA is routinely stored at 4°C for long periods, and freeze drying or ethanol (for liquid samples) is used in many UK labs for short term storage or transport. Two technologies allow long term storage, and transport, at ambient temperatures by mimicking the natural biological mechanism of "anhydrobiosis" (involving drying and preventing rehydrolysis and oxidation by a protective, inert, chemical matrix or coating). GenTegra™ RNA inactivates trace RNase in the liquid phase. Biomatrica provides several products for DNA, RNA and blood storage (see S-Lab Case 10 on use at Stanford University). The workshop heard that the technologies are being used successfully in UK universities for RNA storage and transport, but that an appraisal by Francine Jury for Manchester's CIGMR has decided against their use for DNA storage for the time being. This is due to the technology needed to keep the samples dry, and uncertainty about sample stability after repeated hydration and rehydration cycles or if the chemical matrix needed to be removed for future research."
Source: S-Lab Briefing 4: Effective and Energy Efficient Cold Storage -
Just in Time Supplies
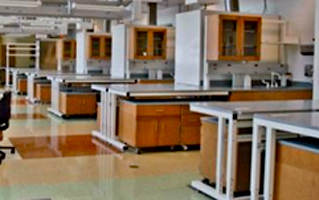
- Sort and Recycle: Take inventory to determine if everything is still necessary.
- Label and Store: Label all supplies and store them in a consistent location.
- Standardize: The bench size with mobile casework.
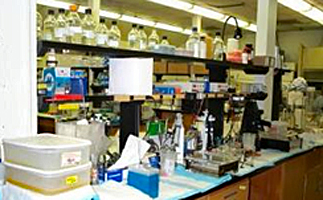
Lab as storage space
Source: Perkins+Will
Lab run with Just in Time supplies
Source: Perkins+Will
Managed Services Link: Thermo Fisher Scientific—Unity Lab Services
3. Understand Building Performance
-
Re-Commissioning
Re-commissioning refers to the commissioning of a building that has been commissioned in the past. When implemented on a regular basis, continuous commissioning can save energy, extend the life of systems and the value of capital assets.
Benefits include:
- Cost is approximately $11/m² ($1/ft²) with a payback that can be less than 1 year.
- "Tuned" systems can also improve occupant comfort.
- Protect assets by ensuring the proper function and optimal performance of all systems.
- Energy savings can exceed 15 to 20%, particularly for energy intensive laboratories.
Significant energy savings can be achieved through re-commissioning by reducing or eliminating:
- Coincident heating and cooling
- Poor sensor calibration
- Sub-optimal control strategies
- Lowering air change rates
- Premature component failure
Initial Costs range from $9 to $15/m² ($0.8 to $1.4/ft²) with a payback that can be less than one year.
-
Wireless Metering and Evaluation
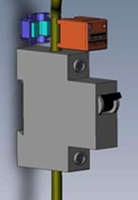
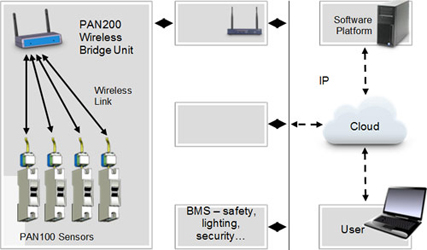
Wireless metering helps with retro-commissioning and budgeting.
Wireless sensor network technologies provide a viable solution in obtaining real time data to under equipment energy profiles, assessing best management practices, evaluating the effectiveness of repair and maintenance, and implementing conditional based maintenance. Wireless metering can be placed where it is needed it when it is needed, which is a very cost-effective solution. Another benefit of wireless metering is that a specific room or a department can be metered within a building to help determine the costs to run the labs and to charge the occupants. The wireless system can be very user friendly. A fully hard wired system with meters in each room and on each floor is usually not necessary or as cost-effective as a wireless system.
Circuit-level monitoring (CLM) primary benefits:
- Identification and targeting of energy saving opportunities—greatly simplifies future energy audits.
- Continuous commissioning of systems.
- Significant maintenance cost savings—CLM can identify system failures in advance
- Educational opportunity
- Performance reporting
- First cost range—$7,500–$10,000 assuming 18,600m² (20,000 GSF) facility
- Ongoing annual service cost between $6,000 and $8,000
- Total cost between $13,500 to $18,000
- Anticipated annual energy savings between $5,000and $15,000
- Anticipated annual maintenance cost savings between $5,000 and $20,000
- Total project savings between $10,000 and $35,000 with an expected Payback range of 1 to 4 years.
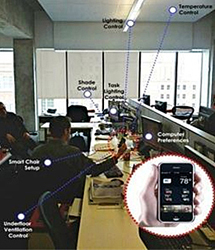
Wireless Controls: Smartphones, Tablets, portable computers can be setup to control immediate environment.
Control extends to:
- Ventilation and number of air changes
- Room Temperature
- Lighting preferences
- Computer setup (screen resolution, monitor height and position, etc.)
Benefits:
- Wireless telemetry allows for more individual controls.
- Better understanding of how the building is operating and performing.
- Personal feedback allows for occupant behavioral transformation resulting in better operations.
- Integrates well with smart grid technologies.
- Person carries environmental preferences with them—enhancing mobile workstation experience.
- Tying into metering could modify occupant behavior.
- Identify and target improvements intelligently.
4. Re-Think the Science of Research
There are many opportunities for researchers to re-think how they carry out research and where there are opportunities to reduce energy costs. A few studies are provided here.
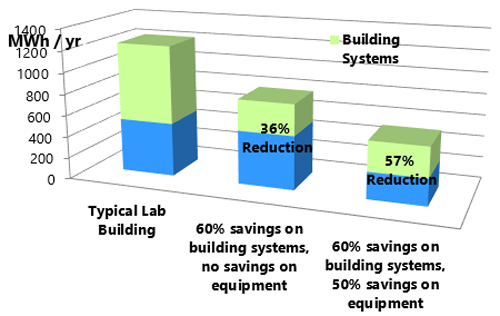
Research buildings are the largest energy users of any building type. The following charts show a study by Peter Rumsey that graphically illustrates how research buildings can become more energy efficient. It is clear that for many research buildings to achieve zero carbon, the efficiency of renewable options like photovoltaics need to improve. The other area of opportunity is for the researchers to change the way they do research. Some ideas include:
- More work on the computer and less chemicals and fume hoods in the labs.
- Zone the research by air change rates and focus on less space for research requiring high air change rates.
- High use of energy efficient sample storage.
And The Research Models Evolve to More Sustainable Processes.
-
Non-Radioactive probes
Improving the Science—study by Jean Tiong- Koehler at NIH
Reduction of Toxic Chemicals
radioactive nucleotides
DAB (3,3'-Diaminobenzidine)
Strategies to green labs and save money
Radioactive probes- short half-life
- reaction: silver grains deposit, requires film
- development time: day to weeks
- cumbersome documentation for ordering, use, storage, transport, monitoring contamination, and waste disposal
Change to Non-Radioactive Probes
- DIG
- shelf life at least a year
- color reaction
- development time: hours—2 days
- signal to noise for weakly expressing gene expression can be a challenge
-
Green Chemistry
Risk = Hazard x Exposure. Less hazardous chemicals used + produced = Less hazardous accidents. Less hazardous chemicals usually require lower air change rates that will reduce energy needs. Using benign chemicals for the research studies can reduce the number of fume hoods necessary and also reduce the energy needs.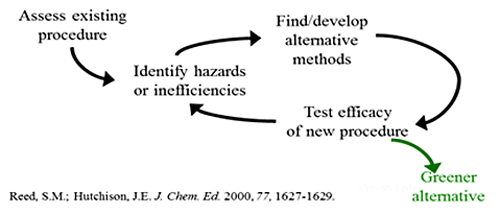
St. Olaf web application for their Green Chemistry program: Green Chemistry Assistant
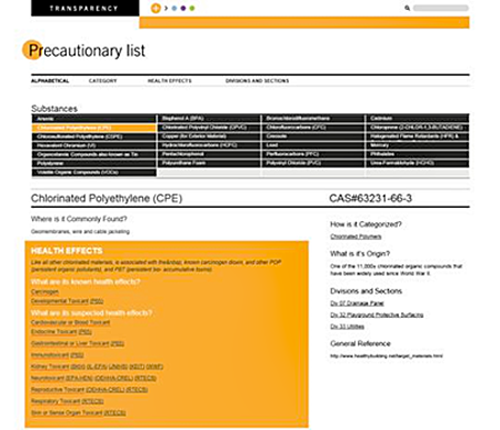
Perkins+Will's link to the "Precautionary List:" Transparency
Institutions with active Green Chemistry programs include:
University of Oregon
- Reduced up-front cost
- 1/3 savings in renovation costs
- Gain additional bench space
- Smaller duct work
- Reduced operating cost
- Reduced airflow ($90,000/year savings from 22 hoods to 5)
- Less waste / less hazardous waste
- Accommodates larger class size
EPA
"The primary way that EPA promotes green chemistry is through the prestigious Presidential Green Chemistry Challenge Awards. EPA also supports green chemistry through projects and programs, including educational activities and research and development."MIT
"The Green Chemical Alternatives Purchasing Wizard is intended as a tool to reduce the hazardous waste profile in research labs, an effort that ultimately saves MIT, and its researchers, money while reducing hazard potentials and the burden to our environment. It is supported by Executive Vice President Curry's Fall 2003 Institute-wide purchasing policy, which identified environmentally preferable purchasing as a sound method for saving money while maintaining MIT's reputation for superior research. It is further supported by MIT's requirement under the Resource Conservation and Recovery Act (RCRA) to identify opportunities for minimizing waste and MIT's Pollution Prevention Program."Greener Education Materials for Chemists
"GEMs is an interactive collection of chemistry education materials focused on green chemistry. Search GEMs database."The Center for Green Chemistry & Green Engineering at Yale
"The Mission of The Center for Green Chemistry and Green Engineering at Yale is to advance sustainability by catalyzing the effectiveness of the Green Chemistry and Green Engineering community."The annual ACS Green Chemistry and Engineering Conference or the ACS Green Chemistry Institute
Royal Society of Chemistry Green Chemistry Network (England)
- Incorporate BioDegradable Plastic Alternatives:
Designed to safely degrade in biologically active landfills. Stringently tested for performance, chemical resistance, thermal stability, and leaching. An economical alternative to current plastics which will remain in the landfill for 100 years or more, creating a long-term pollution problem.
- Microcentrifuge tubes, conical tubes, pipette tips, serological pipettes.
5. Reduce the Waste Stream
-
Non-Hazardous Waste Stream:
-
Identify products that require smaller packaging. Consider re-usable items before purchasing disposables.
-
Paper Waste constitutes over 25% of the waste generated in laboratories. Consider going paperless:
- Electronic protocols
- Electronic data entry
- Sharing of paper information
- Installing paper recycling bins within the lab
Case Study: Zero Waste by 2012 Harvard Recycling Program
-
-
Hazardous Waste Stream
- Consult with an EH&S professional to identify nmethods to decontaminate waste prior to disposal (Cost savings will be significant if items are usually disposed of in the general trash rather than through the hazardous waste stream)
- Identify how the lab produces infectious waste, consider consolidating various activities, research various alternatives readily available to replace chemicals, radioisotopes, and other noxious components from the work stream, implement recycling programs and shared use programs.
- Consult with an EH&S professional to identify nmethods to decontaminate waste prior to disposal (Cost savings will be significant if items are usually disposed of in the general trash rather than through the hazardous waste stream)
Application
Case Study: Princeton University
- Elimination—any modification that results in the elimination of waste generation.
- Substitution—replacement of hazardous substances with less hazardous materials.
- Scale Reduction—a reduction of the amount of hazardous materials used in a procedure.
- Recycling—the reuse of waste materials either back into the same process or into a different process.
- Reclamation—any process that allows materials to be used again after some sort of purification, such as solvent distillation.
- Treatment—an additional step added to an experimental or analytical procedure to reduce or eliminate the toxicity of the waste.
Case Study: Mt. Baker Bio's 360 Sustainable Labs—Tips for greening up your lab
- Reuse: Plastic tip boxes are sterilized, re-filled and re-used by various labs.
- Re-purpose: Polyproylene re-grind is used to make new lab products such as tube racks and Molecular Workstations.
- Recycle: Any extra pastic is recycled using direct local recycling partnerships.
Conclusion
The path towards 2030 begins with buy in from users within the lab and facilities management outside of the lab. The only way to realize a carbon neutral facility is to build on incremental change in each successive phase. Near term goals, to be implemented by 2015 form the foundation upon which 2030 is achieved. Taking advantage of the "low hanging fruit" by 2015 that represents a 10–20% energy reduction is achieved by simply changing mindsets. Many of these initial steps towards 2030 can be done now with little or no cost. However, they represent a significant and lasting financial payback that will be realized within the first five years.
Relevant Codes and Standards
Federal Mandates
- Energy Policy Act of 2005
- Executive Order 13693, "Planning for Federal Sustainability in the Next Decade"
Additional Resources
Federal Agencies and Programs
- U.S. Department of Energy
- U.S. Environmental Protection Agency
- Laboratories for the 21st Century (Labs21 Video)—Sponsored by the U.S. Environmental Protection Agency and the U.S. Department of Energy, Labs21 is a voluntary program dedicated to improving the environmental performance of U.S. laboratories.
- Labs21 Tool Kit
- A Design Guide for Energy-Efficient Research Laboratories—A reference that helps facility owners, managers, and designers and apply energy-efficiency features in laboratories.
- Environmental Performance Criteria—A rating system specifically designed to assess environmental performance of laboratories.
Organizations and Associations
- American Council for an Energy-Efficient Economy (ACEEE)
- The American Institute of Architects (AIA) Committee on the Environment (COTE)
- American Society of Heating, Refrigerating, and Air-Conditioning Engineers (ASHRAE)
- American Solar Energy Society (ASES)
- Center for Resourceful Building Technology (CRBT)
- Sustainable Buildings Industry Council (SBIC)
- U.S. Green Building Council

